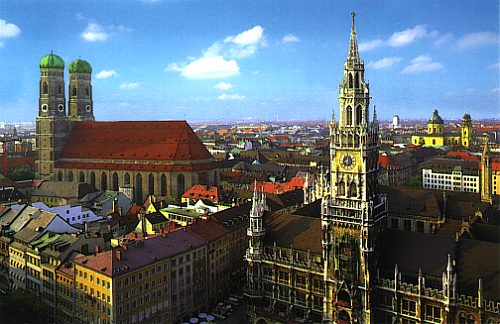
| Munich |
|
|
|
| Institutions: | Contact persons:
|
| General Data Munich |
| Geographic longitude (east) | 11° 34' 28'' | |||
| Geographic latitude (north) | 48° 8' 23'' | |||
| Total area (km˛) | 310 | Inhabitants (1.1.1950) | 832 000 | |
| Settlement area (%) | 39 | Inhabitants (1.1.1970) | 1 312 000 | |
| Traffic area (%) | Inhabitants (1.1.1997) | 1 324 000 | ||
| Agricultural area (%) | Density of Inhabitants( I / km˛) | 4277 | ||
| Forested area (%) | ||||
| Water bodies (%) | Motor vehicles (1.1.1950) | |||
| Road network (km) | 2272 | Motor vehicles (1.1.1970) | ||
| Mean altitude (above sea-level) | 530 | Motor vehicles (1.1.1997) | 729 520 | |
| Lowest point (above sea-level) | 482 | |||
| Highest point (above sea-level) | 579 | Motor vehicles / 1000 inhabitants (1997) | 552 |
| Air Pollution Munich 1997 |
| Stations | SO2 (µg/mł) |
NO2 (µg/mł) |
NO (µg/mł) |
CO (µg/mł) |
O3 (µg/mł) |
Staub (µg/mł) |
| Stachus | 6 | 56 | 72 | 1700 | 25 | 61 |
| Effnerplatz | 7 | 55 | 84 | 1500 | 48 | |
| Lothstrasse | 6 | 49 | 32 | 900 | 33 | 37 |
| L.-Kiesselbach-Platz | 8 | 65 | 111 | 1500 | 49 | |
| Johanneskirchen | 4 | 31 | 16 | 600 | 41 | 38 |
| Mean climatic data (1951-1970) Munich |
| Jan | Feb | Mar | Apr | May | Jun | Jul | Aug | Sep | Oct | Nov | Dec | Year | |
| Air temperature (°C) | -2.0 | -0.9 | 3.1 | 8.1 | 12.0 | 15.8 | 17.5 | 16.6 | 13.8 | 8.6 | 3.4 | -0.7 | 7.9 |
| Absolute highest temperature (°C) |
|||||||||||||
| Mean daily highest temperature (°C) |
1.1 | 2.9 | 7.7 | 13.2 | 17.1 | 20.9 | 22.8 | 22.1 | 19.4 | 13.9 | 6.7 | 2.2 | 12.5 |
| Absolute lowest temperature (°C) |
|||||||||||||
| Mean daily lowest temperature(°C) |
-5.2 | -4.5 | -1.0 | 3.3 | 6.8 | 10.7 | 12.5 | 11.8 | 9 | 4.4 | 0.4 | -3.6 | 3.7 |
| Icedays (< 0 °C) | 12.3 | 8.6 | 2.8 | 0.1 | 0 | 0 | 0 | 0 | 0 | 0 | 1.9 | 10.3 | 36.0 |
| Frostdays (min. < 0 °C) | 25.8 | 21.3 | 16.6 | 5.8 | 0.6 | 0 | 0 | 0 | 0.1 | 4.5 | 13.2 | 23.1 | 110.9 |
| Heating days (mean < 15 °C) | |||||||||||||
| Summerdays (>= 25 °C) | 0 | 0 | 0 | 0.5 | 1.7 | 6.1 | 10.4 | 8.3 | 3.7 | 0.1 | 0 | 0 | 30.9 |
| Hot days (>= 30 °C) | 0 | 0 | 0 | 0 | 0 | 0.4 | 2.3 | 1.4 | 0.2 | 0 | 0 | 0 | 4.3 |
| Days with precipitation (>0.1 mm) | 16.5 | 16.8 | 15.1 | 15.9 | 16.9 | 17.9 | 16.4 | 16.4 | 12.4 | 11.7 | 15.0 | 17.1 | 188.0 |
| Precipitation (l/m˛) | 55.5 | 55.8 | 53.6 | 67.8 | 109.0 | 135.9 | 131.1 | 111.5 | 70.0 | 57.6 | 44.9 | 55.1 | 947.9 |
| Windspeed (m/s) | 3.6 | 3.7 | 3.6 | 3.5 | 3.2 | 3.0 | 3.0 | 2.9 | 2.8 | 2.8 | 3.1 | 3.3 | 3.2 |
| Sun altitude (Degrees) | |||||||||||||
| Sunshine (hours) | 60.2 | 78.9 | 133.9 | 169.7 | 205.5 | 215.2 | 236.5 | 213.0 | 180.4 | 137.3 | 54.4 | 41.4 | 1730.3 |
| Sunshine hours/day |
|||||||||||||
| Global radiation (W/m2) |
|||||||||||||
| Global radiation kWh/m˛ day |