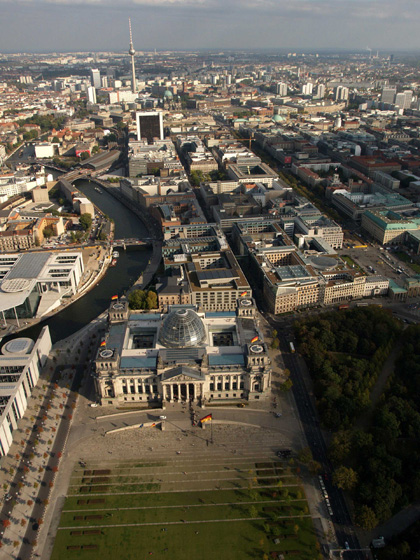
| Berlin |
|
|
||
| Institutions/contacts: | Websites: | contact for remarks: | |
| General
Data Berlin | Source of data: Statistical yera book Jahrbuch Berlin 2004 |
| Geographic latitude (eastern latitude) | 13° 24' 36" | |||
| Geographic longitude (norhern longitude) | 52° 31' 12" | |||
| Total area (km²) | 891,67 | Inhabitants (01.01.1950) | 3.336.026 | |
| Settlement area (km²) (01.01.2004) | 483,00 | Inhabitants (01.01.1970) | 3.207.786 | |
| traffic area (km²) (01.01.2004) | 135,68 | Inhabitants (30.06.2004) | 3.328.291 | |
| Agriculture area (km²) (Stand:01.01.2004) | 43,93 | Density of inhabitants (I./km˛) | 3.732 | |
| Forest area (km²) (01.01.2004) | 160,54 | |||
| Water bodies (km²) (01.01.2004) | 59,28 | Motor vehicles (01.01.1950) | no data available | |
| Road network (km) (01.01.2004) | 5.334 | Motor vehicles (01.01.1970) | 457.000 | |
| Mean altitude (above sea-level) | 35 m | Motor vehicles (01.01.2005) | 1.419.217 | |
| Lowest point (above sea-level)) | 29,5 m | |||
| Highest point (above sea-level) | 115 m | Motor vehicles per 1000 inhabitants (2005) | 426 | |
Climate/Air |
||||
| Mean Climate Data (1961-1990) Berlin-Dahlem |
| Jan | Feb | Mar | Apr | May | June | July | Aug | Sept | Okt | Nov | Dec | Year | |
| Temperature (°C) | -0,4 | 0,6 | 4,0 | 8,4 | 13,5 | 16,7 | 17,9 | 17,2 | 13,5 | 9,3 | 4,6 | 1,2 | 8,9 |
| Absolute highest temperature (°C) *) | 15,2 | 18,6 | 25,1 | 30,9 | 33,2 | 35,0 | 37,8 | 37,7 | 34,2 | 27,5 | 19,5 | 15,7 | 37,8 |
| Mean daily maximum temperature (°C) | 1,8 | 3,5 | 7,9 | 13,1 | 18,6 | 21,8 | 23,1 | 22,8 | 18,7 | 13,3 | 7,0 | 3,2 | 12,9 |
| Absolute lowest temperature (°C) *) | -21,0 | -26,0 | -16,5 | -6,7 | -2,9 | 0,8 | 5,4 | 4,7 | -0,5 | -9,6 | -16,1 | -20,2 | -26,0 |
| Mean daily minimum temperature (°C) | -2,9 | -2,2 | 0,5 | 3,9 | 8,2 | 11,4 | 12,9 | 12,4 | 9,4 | 5,9 | 2,1 | -1,1 | 5,1 |
| Ice days (max. <0°C) | 9,2 | 5,9 | 1,3 | <0,1 | 0 | 0 | 0 | 0 | 0 | <0,1 | 1,3 | 7,2 | 24,8 |
| Frosty days (min. <0°C) | 19,9 | 17,6 | 12,6 | 3,4 | 0,2 | 0 | 0 | 0 | <0,1 | 1,3 | 8,4 | 17,0 | 80,3 |
| Heating degree days | 31,0 | 28,0 | 31,0 | 29,8 | 13,2 | 3,9 | 0,8 | 0,7 | 9,4 | 31,0 | 30,0 | 31,0 | 239,8 |
| Summer days (>25°C) | 0 | 0 | <0,1 | 0,4 | 3,3 | 7,8 | 10,3 | 9,1 | 2,1 | 0,1 | 0 | 0 | 33,1 |
| Hot days (>30°C) | 0 | 0 | 0 | 0,1 | 0,2 | 1,2 | 2,5 | 1,6 | 0,1 | 0 | 0 | 0 | 5,6 |
| Days with precipitation > 0,1 mm | 17,8 | 14,3 | 15,5 | 14,2 | 14,0 | 14,9 | 13,9 | 13,4 | 14,4 | 14,3 | 17,0 | 18,2 | 181,9 |
| Precipitation (l/m˛) | 43,2 | 36,6 | 37,5 | 42,2 | 55,3 | 70,7 | 53,1 | 65,3 | 45,5 | 35,8 | 49,5 | 54,5 | 589,2 |
| Mean wind speed (m/sec) | 3,4 | 3,5 | 3,8 | 3,3 | 3,1 | 3,0 | 2,9 | 2,8 | 2,8 | 2,9 | 3,3 | 3,3 | 3,2 |
| Sun altitude (degrees, on 15th of month) | 16,4 | 24,8 | 35,4 | 47,3 | 56,4 | 60,8 | 59,1 | 51,6 | 40,6 | 29,0 | 19,0 | 14,3 | 37,5 |
| Sunshine (hours) | 45,4 | 72,3 | 122,1 | 157,7 | 221,6 | 220,9 | 218,0 | 210,2 | 156,3 | 110,8 | 52,4 | 37,4 | 1624,8 |
| Sunshine (hours/day) | 1,5 | 2,6 | 3,9 | 5,3 | 7,1 | 7,4 | 7,0 | 6,8 | 5,2 | 3,6 | 1,7 | 1,2 | 4,4 |
| Global radiation (W/m˛) |
23 | 48 | 98 | 142 | 195 | 217 | 198 | 160 | 122 | 65 | 27 | 17 | 110 |
| Global radiation (kWh/m˛ per day) |
0,52 | 1,14 | 2,34 | 3,39 | 4,66 | 5,18 | 4,73 | 3,82 | 2,91 | 1,55 | 0,64 | 0,40 | 2,62 |
*) 1909-1999
Data sources: "Beilagen zur Berliner Wetterkarte" (KBD),
Institute of Meteorology, Free University Berlin;
Hupfer, P. and Chmielewski, F.-M.: "Das Klima von Berlin", 1990