 |
- Geographic latitude: 37°58´N
- Geographic longitude: 23°43´E
- Altitude: 107 m
- Climatic type: Köppen Csa
- General data
- Air Pollution
- Mean climatic data
- Athens-Map
- Topography
- Satellite Image
- Projects
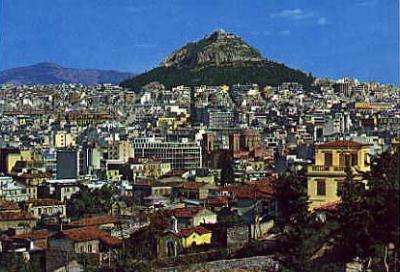
| Athens |
|
|
|
| Institutions: |
Contact persons: |
| General Data Athens |
| Geographic longitude (east) | ||||
| Geographic latitude (north) | ||||
| Total area (km˛) | Inhabitants (1.1.1950) | |||
| Settlement area (%) | Inhabitants (1.1.1970) | |||
| Traffic area (%) | Inhabitants (1.1.1997) | |||
| Agricultural area (%) | Density of Inhabitants( I / km˛) | |||
| Forested area (%) | ||||
| Water bodies (%) | Motor vehicles (1.1.1950) | |||
| Road network (km) | Motor vehicles (1.1.1970) | |||
| Mean altitude (above sea-level) | Motor vehicles (1.1.1997) | |||
| Lowest point (above sea-level) | ||||
| Highest point (above sea-level) | Motor vehicles / 1000 inhabitants (1997) |
| Air Pollution Athens |
No data available
| Mean climatic data Athens |
Parameter |
JAN |
FEB |
MAR |
APR |
MAY |
JUN |
JUL |
AUG |
SEP |
OCT |
NOV |
DEC |
YEAR |
Period |
Mean air temperature (°C) |
9.3 |
9.9 |
11.3 |
15.3 |
20 |
24.6 |
27.6 |
27.4 |
23.5 |
19 |
14.7 |
11 |
17.8 |
|
Mean maximum air temperature (°C) |
12.9 |
13.9 |
15.5 |
20.2 |
25 |
29.9 |
33.2 |
33.1 |
29 |
23.8 |
18.6 |
14.6 |
22.5 |
30 |
Mean minimum air temperature (°C) |
6.4 |
6.7 |
7.8 |
11.3 |
15.9 |
20 |
22.8 |
22.8 |
19.3 |
15.4 |
11.7 |
8.2 |
14 |
30 |
Absolute maximum air temperature (°C) |
20.9 |
22.5 |
27.8 |
32.2 |
36.2 |
41.9 |
42.3 |
42.6 |
38.4 |
36.5 |
27.7 |
22.2 |
42.6 |
30 |
Absolute minimum air temperature (°C) |
-4.4 |
-5.7 |
-.7 |
-.3 |
6.2 |
13.6 |
16 |
15.5 |
11.6 |
7.2 |
-1.1 |
-3.7 |
-5.7 |
30 |
Mean relative Humidity (%) |
74 |
70 |
67 |
63 |
59 |
53 |
47 |
47 |
56 |
67 |
73 |
75 |
63 |
|
Mean precipitation (mm) |
62 |
36 |
38 |
23 |
23 |
14 |
6 |
7 |
15 |
51 |
56 |
71 |
402 |
|
Maximum precipitation (mm) |
||||||||||||||
Minimum precipitation (mm) |
||||||||||||||
Maximum precipitation in 24 h (mm) |
47 |
61 |
42 |
30 |
50 |
49 |
24 |
39 |
143 |
67 |
57 |
48 |
143 |
30 |
Days with precipitation |
12 |
11 |
10 |
8 |
7 |
5 |
2 |
3 |
4 |
8 |
12 |
12 |
93 |
|
Mean sunshine (h) |
149 |
156 |
190 |
215 |
232 |
292 |
364 |
340 |
272 |
210 |
129 |
108 |
2655 |
|
Radiation (Ly/d) |
||||||||||||||
Potential evaporation (mm) |
16 |
17 |
30 |
52 |
91 |
136 |
174 |
160 |
109 |
70 |
36 |
22 |
913 |
36 |
Mean wind speed |
1.9 |
2.2 |
2.7 |
1.8 |
1.8 |
1.8 |
2.2 |
2.2 |
1.9 |
1.8 |
2.3 |
2.1 |
2.0 |
|
Wind direction |
NE |
NE.SW |
NE |
NE |
S |
SW |
NE |
NE |
NE |
NE |
NE |
NE |
Source of climatic data: M. Müller, 1983: Handbuch ausgewählter Klimastationen der Erde. Universität Trier. Forschungsstelle Bodenerosion.